
There is a particular kind of silence that every hardware engineer dreads. Not the silence before a presentation or before a code review. The silence after you apply power to a new board for the first time, and the device doesn’t respond. The bus is quiet. The enumeration never happens.
We’ve been in that room a lot. For 16 years, the teams building the world’s most complex hardware have brought us in to help figure out what went wrong. Semiconductor companies, storage vendors, mobile OEMs, and automotive suppliers, across every major serial interface in use today, across every stage of the development cycle.
After all of that, we’ve condensed everything we’ve learned into the patterns that show up on almost every bring-up, regardless of the team or the technology. We’ve put it all together here in this article.
Where We Started and What We Were Already Seeing
We founded Prodigy in 2009 with a fairly specific problem in mind. The teams doing hardware bring-up at the time had excellent oscilloscopes and very little software that actually understood what the signals on the bus meant. You could see the waveform. You couldn’t see the protocol.
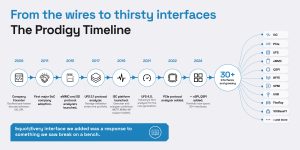
So we started there, building oscilloscope-based decode and analysis software for the interfaces that dominated embedded design at the time: I2C, SPI, the buses that powered the world’s sensors and controllers.
It didn’t take long to see the deeper problem. Even with better visibility into the signal, engineers were still losing days to bugs that lived one layer away from where they were looking. The firmware team pointed at the hardware. The hardware team pointed at the firmware. And the interface between the two, the protocol itself, running on real silicon with real parasitics and real noise, had no dedicated tool watching it.
That observation drove everything we built after that.
What Sixteen Years of Bring-Ups Taught Us
As we grew, from I2C and SPI into eMMC and SD in 2015, into UFS and I3C as those interfaces matured, into PCIe, RFFE, SPMI, and beyond, the customer problems scaled with the interfaces. However, three lessons came up so consistently, across so many teams and industries, that they stopped feeling like individual observations and started feeling like laws.
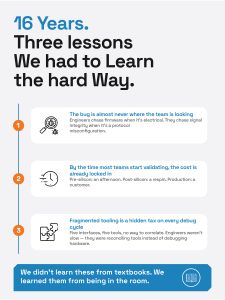
Lesson 1: The bug is almost never where the team is looking
Here’s a scenario we’ve seen more times than we can count: A device is missing In-Band Interrupts intermittently on an I3C bus. The firmware team digs in. After all, the IBI handling logic lives in the stack, so that’s where you start. They add logging, adjust timing parameters in software, and try different configurations. Days pass, but nothing changes.
Eventually, someone puts a protocol analyzer on the bus and pulls up the timing diagram. The issue isn’t in the firmware at all. There’s a timing violation at the physical layer, the bus isn’t meeting the I3C spec for clock high time, and the firmware was never designed to handle a malformed signal gracefully. It’s an electrical problem wearing a firmware costume.
The reverse happens just as often. Teams chase signal integrity for days when the real issue is a protocol misconfiguration that a decoded trace would have flagged in minutes.
The root cause in both cases is the same: no simultaneous visibility across the electrical and protocol layers. Teams start at the layer they know best and work outward. When the answer is somewhere else, they find it late.
This is why we built the multi-domain view into our I3C Protocol Analyser and Exerciser. A single GUI that shows the raw waveform, the decoded protocol frames, and the exerciser output together, correlated automatically. Not as a feature addition, but as a direct response to watching this exact pattern cost teams weeks of debug time across project after project. When you can see both layers at once, cross-layer bugs stop being a mystery.
Lesson 2: By the time most teams start validating, the cost is already locked in
This one is uncomfortable to say, but it’s true.
| When the bug is found | What it costs |
| Pre-silicon / Emulation | An engineer’s afternoon |
| Post-silicon validation | Weeks of debug, potential respin |
| Production | Customer escalations, field returns, conversations nobody wants |
We watched this play out repeatedly as our customer base grew to include top semiconductor and storage companies globally. The tools would show up after the silicon did. The exerciser, the thing that could have stress-tested the design at emulation stage and found the corner cases before anything was taped out, would get provisioned after the first respin was already ordered.
What this taught us shaped how we think about the product range. Prodigy’s I3C Protocol Analyzer and Exerciser isn’t just a post-silicon debug tool. It’s explicitly designed for pre-silicon traffic generation at the emulation and prototype stage. The I3C Lite and USB Adapter extend that coverage further, from bench validation all the way to production test. The idea is that protocol validation should run in parallel with development at every stage, not wait at the finish line.
When you find corner-case bugs at the emulation stage, you fix them for almost nothing. The same bug found post-silicon is a completely different conversation.
Lesson 3: The interfaces kept multiplying, and fragmented tooling was making everything worse
In 2009, a typical embedded design had one or two serial interfaces. By the time we launched our UFS analyzer in 2017 and our I3C platform in 2019, the SoCs our customers were validating ran five, six, seven interfaces simultaneously: I3C, PCIe, UFS, SPMI, RFFE, eMMC, and QSPI all on the same chip, each with its own protocol stack, timing requirements, and compliance spec.
And most teams were managing a different tool from a different vendor for each one.
The serial interface testing friction this created was enormous. Different software paradigms, different trigger models, different trace formats, no way to correlate events across interfaces without doing it manually. Engineers weren’t slow, they were spending half their time reconciling tools instead of debugging hardware.
This is what drove our expansion across the portfolio. Not just adding interfaces for coverage, but building each tool on a consistent foundation: the same approach to protocol decode, the same trigger model, the same scripting environment. So that a team validating I3C sideband on a PCIe SSD, RFFE on a 5G modem, and UFS on a mobile SoC isn’t learning three separate workflows. They’re working in one coherent validation stack.
What Good Validation Infrastructure Actually Looks Like
After all of that, here’s what the teams that do SoC validation well consistently share:
They cover the full stack. From electrical signal integrity at the physical layer through protocol decode and into application-layer compliance. When the waveform and the decoded frame are in the same view, cross-layer bugs take minutes. Without that, they take days.
They start early. Validation tools that arrive at post-silicon are half as useful as they’d be at the emulation stage. The teams that bring exercisers and analyzers in early don’t just find bugs faster — they find different bugs. The corner cases that only appear under error injection or margin stress show up in pre-silicon exercising. Without that, they show up as customer escalations.
Their exerciser and analyzer live in the same environment. Same clock, same software, same trigger model. When the tool generating the traffic and the tool capturing the response are the same instrument, engineers spend their time on hardware debugging, not on reconciling two separate data streams.
Sixteen Years In and Still Building
Prodigy today covers 30+ interfaces across semiconductor, storage, mobile, automotive, and networking. I3C, PCIe Gen 5, UFS 2.x through 5.0, eMMC, SD, QSPI, RFFE, SPMI, USB, FlexRay, 100BaseT1, and more, analyzers and exercisers, built from the ground up for each protocol, not adapted from something generic.
What hasn’t changed since 2009 is the conviction behind all of it. The teams building the world’s most complex hardware deserve tools that understand the protocols as well as they do. Every interface we’ve added, every feature we’ve built, traces back to something we saw break on a bench somewhere, a pattern that kept repeating until we decided to build the thing that would stop it.
When your bring-up schedule has no room for surprises, the last thing you want is a tool that runs out of depth before your problem does.
Explore the full range at prodigytechno.com/products.
If you’re passionate about hardware validation and semiconductor innovation, explore career opportunities at Prodigy Technovations.