
There’s a particular kind of engineering post-mortem that nobody wants to sit through. The one where a device passed every single lab test, shipped to a customer, and then failed in a way nobody anticipated.
When you tested it, the traffic looked clean, the enumeration worked, and your reads and writes completed without a single error. The protocol analysis logs were, frankly, beautiful. And then a customer reported that under a specific command sequence, it locked up and never recovered.
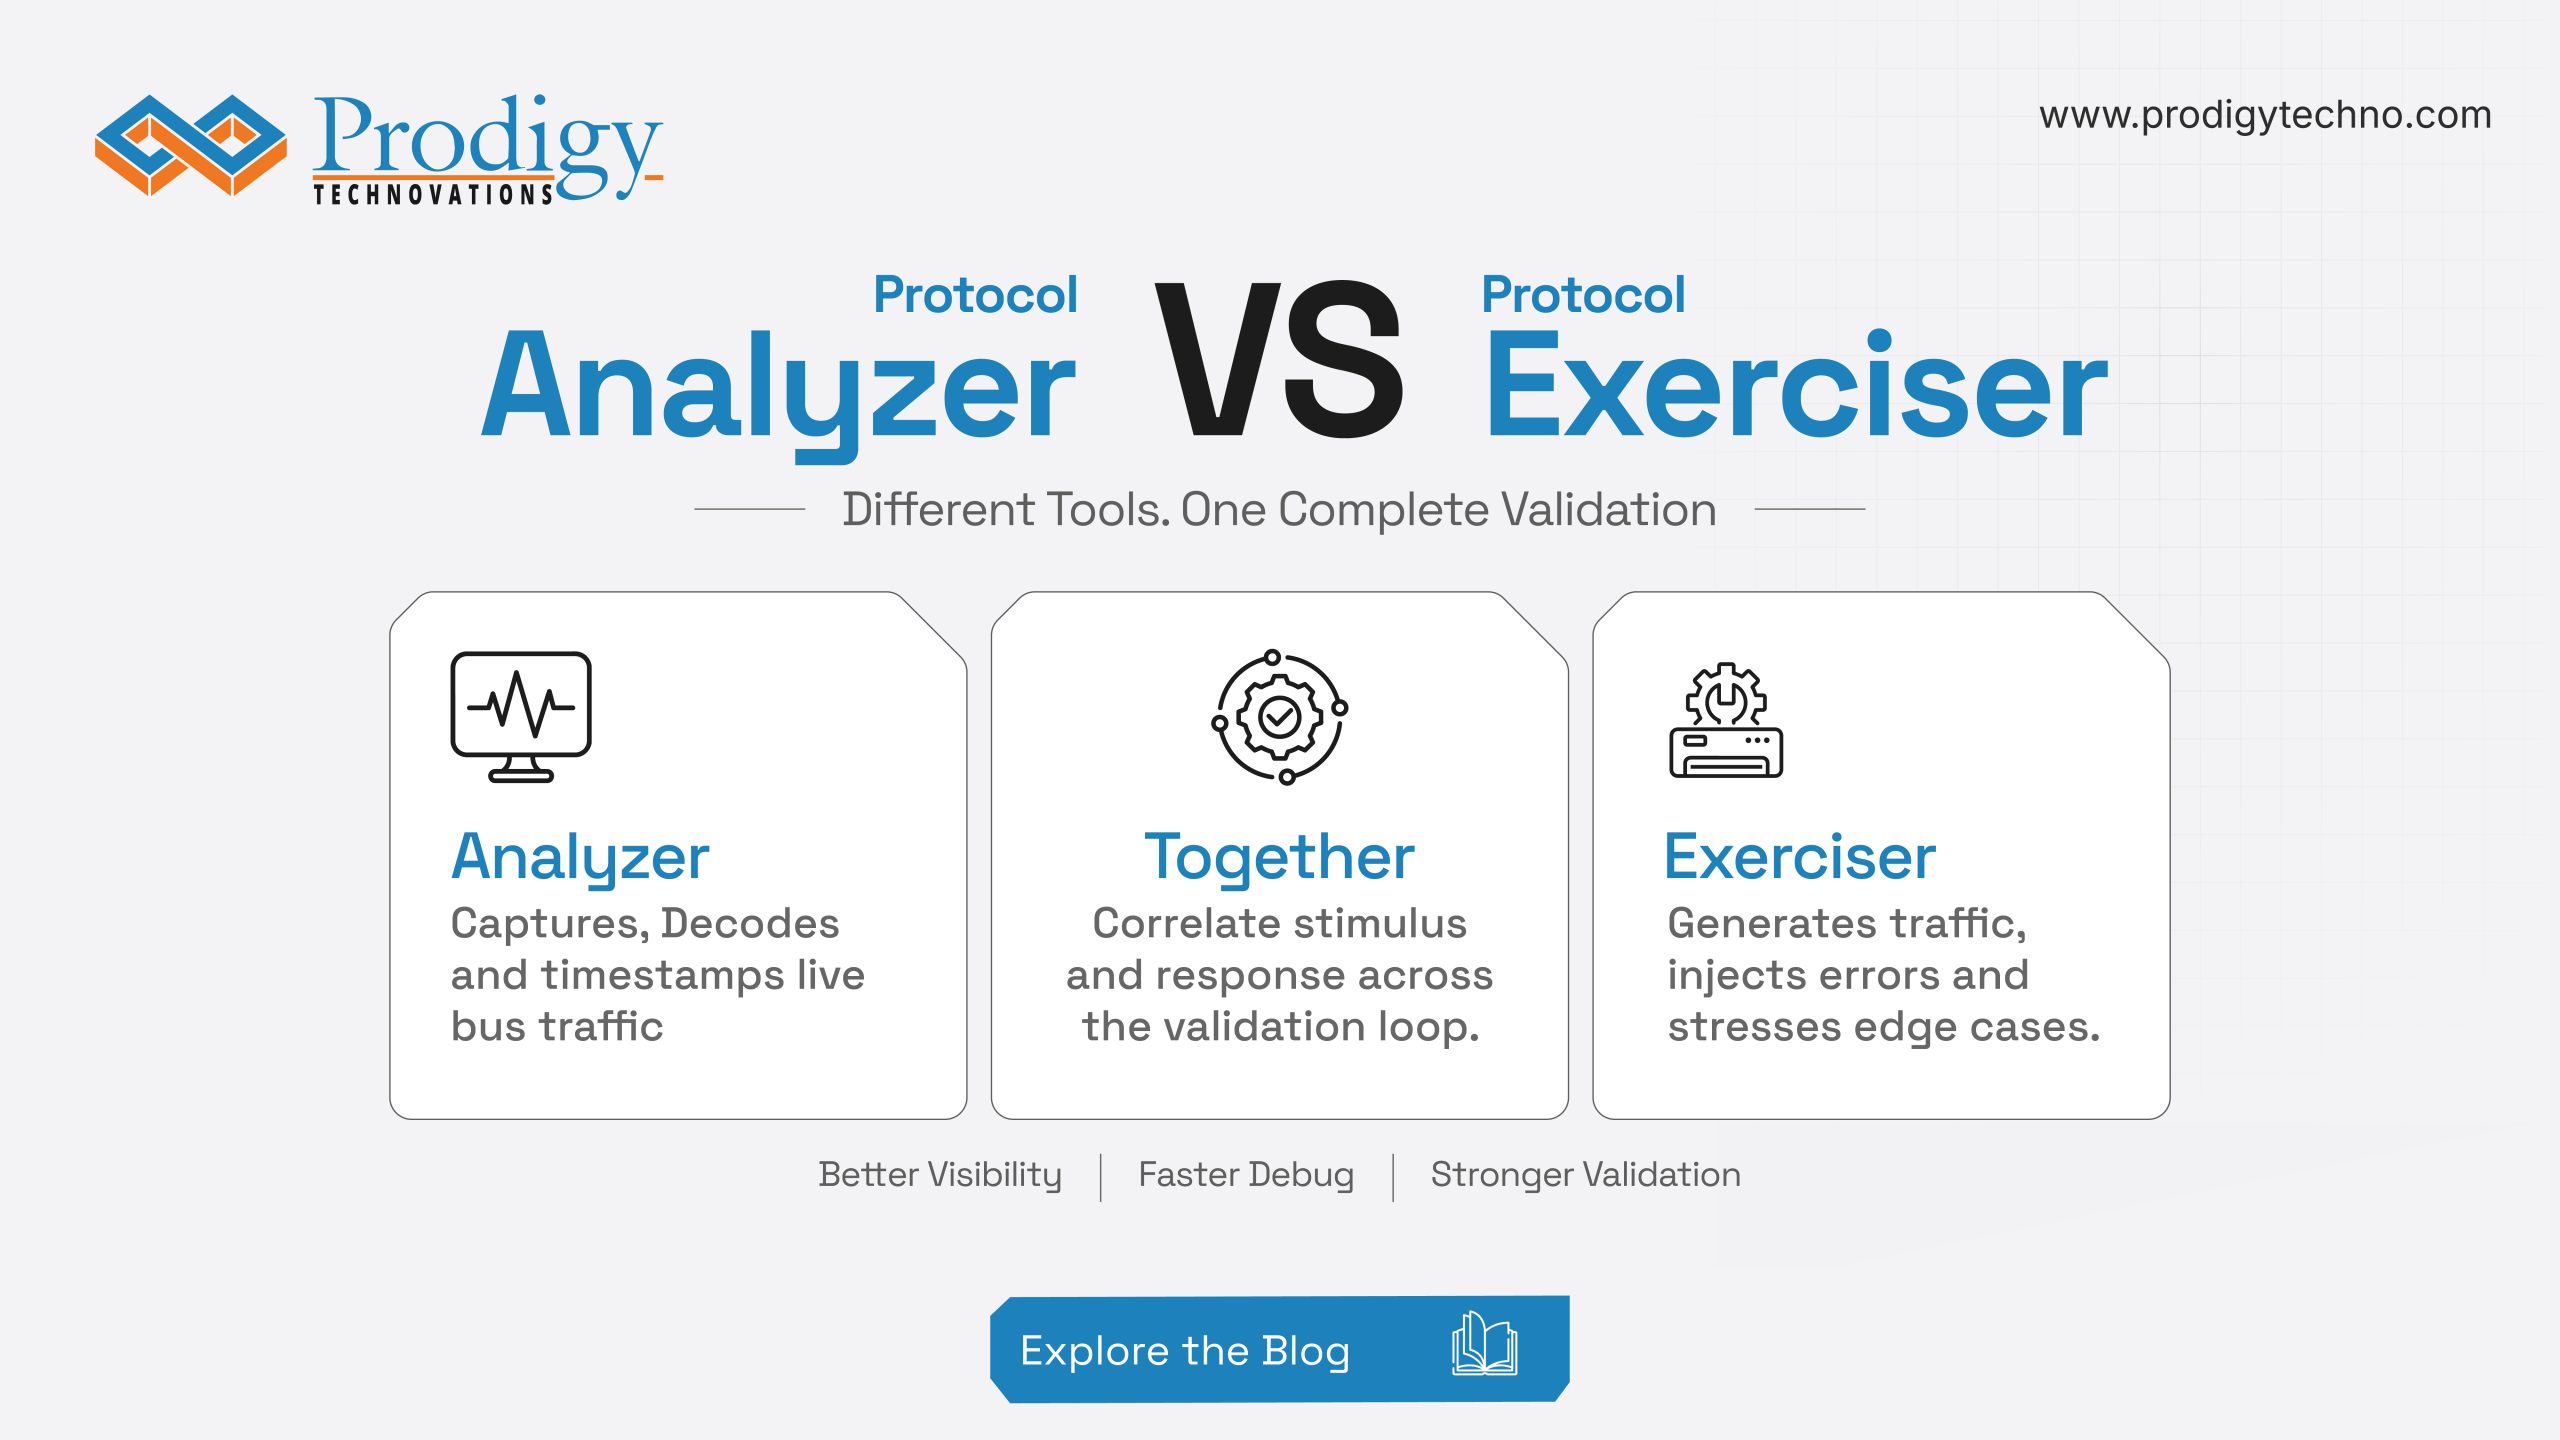
The team had a great protocol analyzer. What they didn’t have was a protocol exerciser. This gap, between watching what your bus does and controlling what the bus does, is exactly where the most expensive bugs in hardware development tend to hide.
What a Protocol Analyzer Actually Does
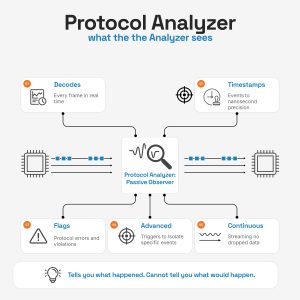
A protocol analyzer is a passive observer. It sits on the bus, captures every transaction in real time, decodes frames, timestamps events, and flags errors it detects in the live traffic. It gives you a full, readable view of what’s happening between your host and your device.
At bring-up, it’s your most important tool. When an interface isn’t enumerating or when a device isn’t responding, you need to understand what’s actually on the wire before you can form any hypothesis about what’s wrong. The analyzer is where you start.
Good analyzers do more than just capture. Here’s what separates a purpose-built protocol analyzer from a generic logic analyzer on a bench:
- Protocol-aware decode. Not just toggling signals but fully decoded frames, command sequences, and response validation at the protocol layer.
- Advanced triggers. The ability to isolate specific events like a missed ACK, a CRC error, a particular command without manually sifting through thousands of frames.
- Timing diagrams with protocol overlay. So you can see the electrical behaviour and the protocol decode in the same view, correlated automatically.
- Continuous streaming. Long captures that don’t drop data, because the bug you’re looking for rarely happens in the first ten seconds.
This is what we’ve built across Prodigy’s protocol analyzer range: purpose-built tools for I3C, PCIe Gen 5, UFS 2.x through 5.0, eMMC, SD, QSPI, RFFE, SPMI, USB, and automotive interfaces including FlexRay and 100BaseT1. Each analyzer is designed from the ground up for the protocol it supports, not a generic instrument stretched to cover interfaces it wasn’t built for.
However, here’s the honest limitation of any analyzer, including ours: it can only show you what the bus is already doing. It cannot create conditions. It cannot provoke a response. It tells you what happened. It cannot tell you what would happen if things went wrong.
What a Protocol Exerciser Does
A protocol exerciser doesn’t observe. It participates.
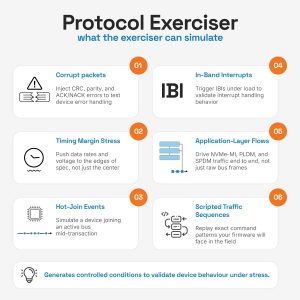
It gets on the bus and acts as a controller, a target, or both simultaneously. It generates traffic, valid traffic, edge-case traffic, and deliberately broken traffic, and it does this under your control, on demand, with full scriptability.
Here’s what that looks like in practice:
| Capability | What it lets you test |
| Error injection (CRC, parity, ACK/NACK) | How your device responds to corrupt or unexpected packets |
| Margin testing (variable data rate, voltage, timing) | Whether your device holds up at the edges of spec, not just the center |
| Hot-join and IBI simulation | How your device handles dynamic bus events mid-transaction |
| Scripted traffic sequences | Exactly the command patterns your firmware will see in the field |
| Controller and target emulation | Full end-to-end validation without needing the real host or device present |
These processes are where the bugs actually live: in the scenario where a packet arrives malformed, where a device tries to assert an interrupt at the exact moment another transaction is in flight, where a host drives a command sequence the firmware wasn’t expecting.
A few things separate a purpose-built protocol exerciser from basic traffic generation tools:
- Scripted automation. The ability to build repeatable test sequences in Python or C++, so you’re not manually recreating scenarios every time
- Conformance test suites. Built-in, one-click test execution for protocol compliance, not a manual checklist but an automated pass/fail report that tells you exactly where and why a test case broke
- Margin testing. Pushing voltage and timing to the edges of spec, because your device will encounter those conditions in the field even if it never encounters them in your lab
Across Prodigy’s I3C exerciser, for example, all of this is built in. Conformance test suites for I3C CTS, MCTP-CTS, NVMe-MI-CTS, and SPDM-CTS, error injection across CRC, parity, and ACK/NACK, hot-join and IBI simulation, and scripted traffic via Python and C++ APIs, are all inbuilt. The difference between a compliance test that takes a day and one that takes an hour is almost always whether the suite is built into the tool or assembled by hand.
Competing Tools or Complementary Ones?
Teams often treat the protocol analyzer and the protocol exerciser as alternatives, as if having one means you don’t need the other. The analyzer is the mature, familiar tool that’s been on validation benches for years. The exerciser feels like an advanced add-on, something you reach for when things get complicated.
That framing is wrong, and it’s expensive.
The analyzer and exerciser are not competitors. They don’t do the same job. They don’t answer the same questions. One tells you what your device is doing. The other tells you how your device behaves when you control what happens to it. Used separately, each one leaves a gap. Used together, they close the loop on hardware validation entirely.
Why You Need Both, and Why They Should Come From the Same Platform
Here’s where the two halves of this conversation come together.
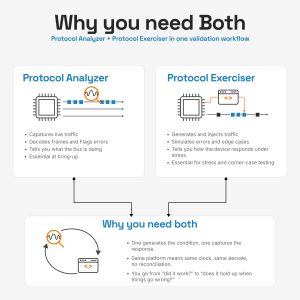
The analyzer tells you what’s happening. The exerciser lets you control what happens. Used together in the same validation workflow, they close the loop completely: the exerciser generates the conditions, the analyzer captures the response, and you get a full picture of device behaviour. This full picture is based not just on ideal conditions, but also on how your device performs under adversarial ones.
Consider three scenarios that validation teams encounter regularly:
- Testing IBI handling under load: You need the exerciser generating high-frequency traffic on the I3C bus while simultaneously issuing an In-Band Interrupt. The analyzer captures the full sequence so you can verify the device responded correctly, in the right order, within spec. Without the exerciser, you can’t create the load condition. Without the analyzer, you can’t verify the response.
- Malformed packet recovery: You inject a deliberately corrupt frame like a bad CRC, wrong parity, malformed header. The exerciser sends it. The analyzer captures what the device does next. Does it recover gracefully? Does it hang? Does it silently drop the error and continue? This is a question you cannot answer with an analyzer alone, because a passive capture only shows you traffic that already exists.
- Application-layer validation over I3C. The exerciser drives NVMe-MI or PLDM traffic end to end. The analyzer decodes every layer, raw I3C frames, MCTP transport, application-layer protocol, in a single correlated view. You’re validating the full stack, not just the bus.
Now here’s the part that teams underestimate. Running these scenarios with separate tools from separate vendors introduces a friction that compounds across every debug cycle. Version mismatches between software environments, incompatible trace formats, different trigger models, no native correlation between what was injected and what was captured. Your engineers aren’t slow, they’re spending time reconciling two separate views of the same event, and that reconciliation adds up across every session in a program.
When the exerciser and analyzer live in the same platform, with the same clock, the same software, and the same protocol decode engine, that problem disappears. You inject, you capture, you debug. The workflow that should take a morning doesn’t spill into a week.
Prodigy’s Combined Approach Across the Full Stack
When we started Prodigy in 2009, the validation tool market had a clear divide. Analyzers on one side, traffic generators on the other, and a gap in between that engineering teams were expected to bridge themselves. We watched teams do it. We watched them lose days to it.
The more interfaces we covered, from I2C and SPI in the early years, through eMMC and SD in 2015, UFS in 2017, I3C in 2019, PCIe in 2022, and xSPI and QSPI in 2024, the more consistent the pattern became. Teams that had both tools but ran them separately were still losing time to correlation friction. Teams that had one tool and not the other were finding their most critical bugs too late, at the wrong stage, at the worst possible cost.
So the question we kept coming back to wasn’t “should we build an analyzer or an exerciser?” It was “why are these two different products from two different vendors in the first place?”
That’s the conviction behind Prodigy’s combined platform approach. Our I3C protocol analyzer and exerciser live in the same instrument, with the same GUI, the same clock, and the same decode engine. What you inject and what you capture are automatically correlated. There’s no reconciliation step, no format conversion, no wondering whether the timestamps line up.
Today, that same philosophy runs across everything we build. Protocol analyzers and exercisers for I3C, PCIe Gen 5, UFS 2.x through 5.0, eMMC, SD, QSPI, RFFE, SPMI, USB, and automotive interfaces, each one purpose-built for the protocol it supports, each one designed to work as part of a coherent validation stack rather than a collection of disconnected instruments.
We’re one of the few companies building both sides of serial bus validation across this range. That’s not an accident. It’s the answer to a problem we watched repeat itself for sixteen years.
If your team is validating hardware across any of these interfaces, explore the full range at prodigytechno.com/products.